
Hello everyone, I will show you how to install SonarQube on Windows Server and integrate with Azure Pipeline for SonarQube Analysis
What is SonarQube?
SonarQube is an automatic code review tool to detect bugs, vulnerabilities, and code smells in your code. It can integrate with your current workflow to enable continuous code inspection across your project branches and pull requests. SonarQube can analyze up to twenty-seven different languages depending on your edition. The output of this analysis will be quality measures and issues (instances where coding rules were broken).
Refer: https://www.sonarsource.com/products/sonarqube/
The advantages of SonarQube are Sustainability, increased productivity, quality code, detection of errors, increased consistency and enhanced developer skills.
SonarQube is a SAST (Static Application Security Testing) tool for rooting out exploitable bugs in coding, whether intentional or unintentional, to secure software by reviewing the source code to identify sources of vulnerabilities.
Below are the hardware requirements:
- A modest-sized SonarQube server instance catering to individual or small team needs necessitates a minimum of 2GB RAM and an additional 1GB of available RAM for the operating system
- The required disk space is contingent upon the volume of code subjected to analysis using SonarQube
- Installation of SonarQube mandates hard drives with exceptional read and write performance
- SonarQube exclusively accommodates 64-bit Operating Systems
What happens during analysis?
Throughout the analysis, the server gathers data, scrutinizes the submitted files, and eventually transmits the resultant data back to the server as a report. This report is subsequently subjected to asynchronous server-side analysis.
How to Create SonarQube Server on Windows: Step-by-Step Approach
- Create a VM on your Azure subscription with Windows Server 2016 Data Center C2 edition. Refer link for hardware configuration recommendations: https://learn.microsoft.com/en-us/windows-server/get-started/hardware-requirements
- Download and Install JDK 11.
- Download SonarQube from the official website.
- Unzip the folder to your required path, e.g., C:/sonarqube-5.6.6
- Change the default port to 80 by navigating to SonarQube’s config folder, e.g., C:/sonarqube-5.6.6/conffolder.
- Open sonar. Propertiesfile using your favorite text editor, e.g., Notepad.
- Replace #sonar. web. port=9000with sonar.web.port=80. Notice we removed the hash #and changed the 9000 to 80. You can refer to Fig.
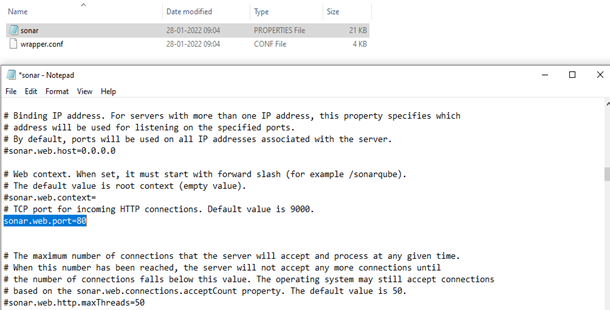
Fig. Port Number Changed from 9000 to 80
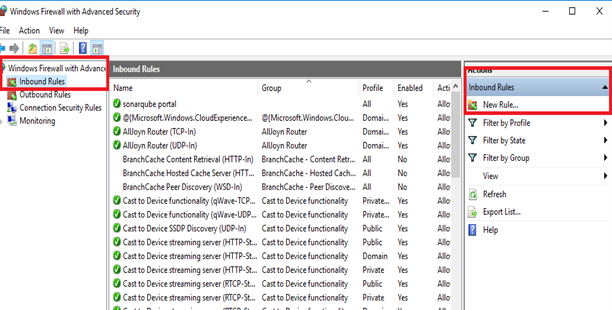
Fig. Addition New Inbound Rule
Rule Type: Port. You can refer to Fig.Rule Type in New Inbound Rule.
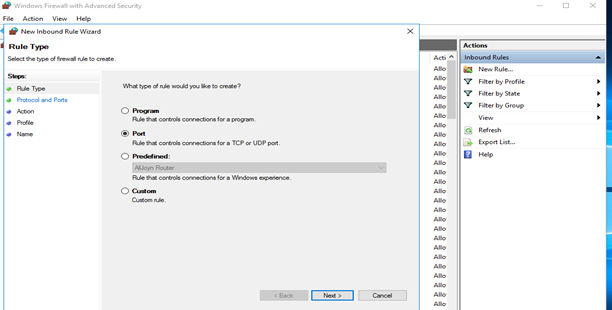
Fig. Rule Type in New Inbound Rule
Protocol and ports: TCP, Specific local ports:80. You can refer to Fig. Rule Type in New Inbound Rule.
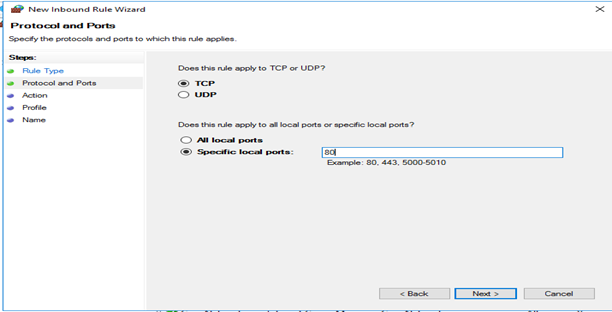
Fig. Protocol and ports in New Inbound Rule
Action: Allow the connection. You can refer to Fig. Action in New Inbound Rule.
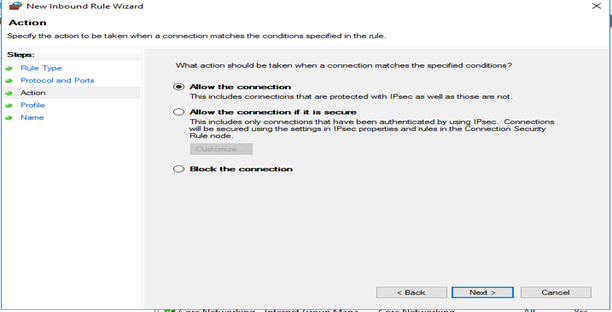
Fig. Action in New Inbound Rule
Profile: Check all the checkboxes and apply.
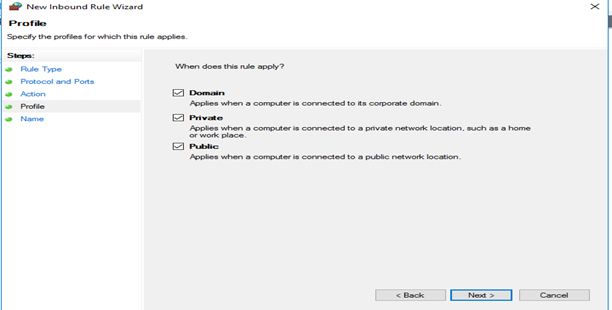
Fig. Profile in New Inbound Rule.
Name: Add the name “SonarQube Portal” and click on the Finish button. You can refer to Fig. Name in the New Inbound Rule.
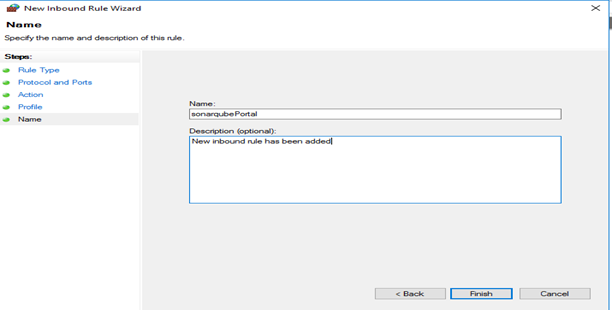
Fig. Name in New Inbound Rule.
New Inbound Rule added: Refer below Fig. Sonarqube Portal Inbound Rule Added.
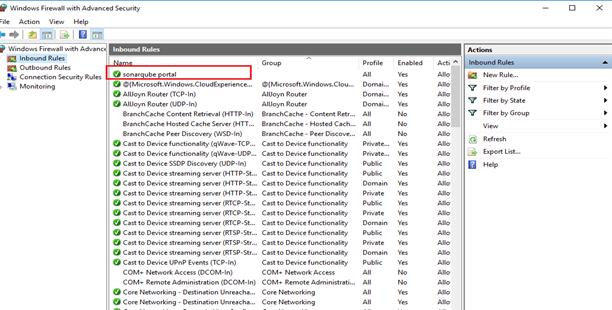
Fig. Sonarqube Portal Inbound Rule Added.
- In the Azure portal, open the server Network Security Group to add Inbound Security rules.
- Go to Add Inbound rule:
Name : SonarQube Portal
Priority: 1010
Source: Any
Service: HTTP
Action: Allow
Click on Add Rule.
- Now to check port is Enable:
Go to the Internet browser and type http://<Server IP address>:<Port no.>. (e.g., https://12.34.56.78:80), It will open the SonarQube Portal.
- Login to SonarQube using default credentials (username= admin, password-admin)
- Now Click on Create a new project.
- Add project from Azure DevOps. You can refer to Fig. Add from Azure DevOps for Configuration.
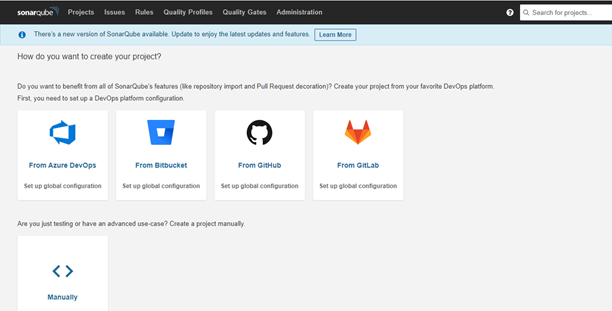
Fig. Add from Azure DevOps for Configuration
- Now, to Create a Configuration: Add the Configuration Name and Provide the DevOps URL – go to Azure DevOps organization, copy the DevOps URL, and paste.
- Create personal access token – click on the user in Azure DevOps, go to security create personal access tokens with full access and paste it, and Save Configuration.
- Again, enter a personal access token to Allow SonarQube to access the list in your Azure DevOps Repositories (a list of all projects will be available).
Select the project you want to create a report and click on Set up a selected repository. For the Above Three Steps, 19,20,21 Refer to the below two Figures, Fig. Create Configuration and Fig. Setup Repository.
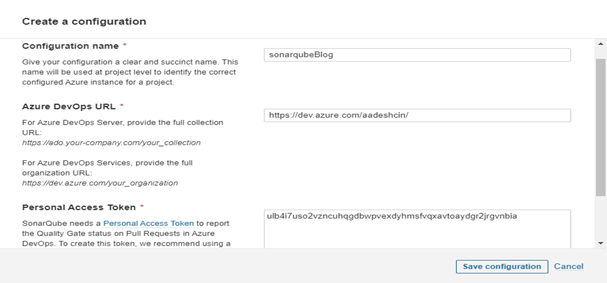
Fig. Create Configuration
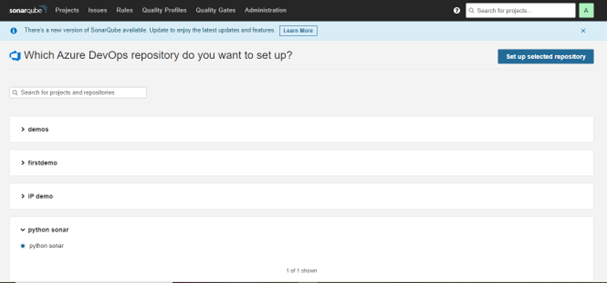
Fig. Setup Repository
Configuring Azure DevOps pipeline for SonarQube Analysis:
- Install the SonarQube extension for Azure DevOps from the marketplace.
- Go to Project Settings in the Azure pipeline à Service connections à Create a service connection for SonarQube à Enter your SonarQube server URL à Generate a new token and paste it into the New SonarQube service connection. Add the service connection name as SonarQube, click the checkbox to grant access, and save.
- Now, for the analysis, provide which programming language code is used in the project.
- Go to the pipeline and add agent jobs like Prepare analysis configuration task before your build task.
- Add Run code analysis task after the build task.
- Click on Finish this tutorial in the browser (SonarQube Server).
- In the pipeline go to Triggers and Enable Continuous Integration.
- Now Save and queue the pipeline.
Now we are done with the build, this will publish all the analysis into the SonarQube dashboard.
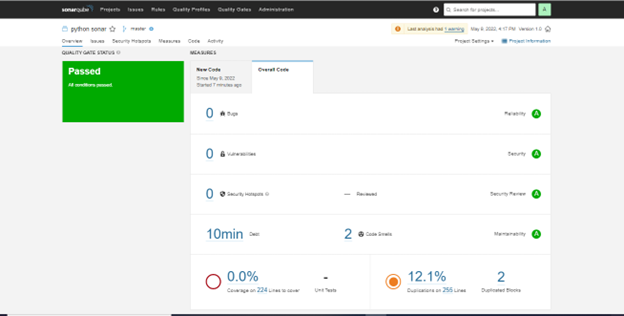
Fig. Analysis Report into SonarQube dashboard
Summary: After reading this article, you will understand better how to set up SonarQube Server on an Azure Windows VM and Configuring the Azure DevOps pipeline for SonarQube Analysis.
Below are the different Static code analysis tools for reference:
SonarQube, Coverity, Raxis, Veracode, Code Scene.
References:
- https://learn.microsoft.com/en-us/azure/devops/pipelines/?view=azure-devops
- https://docs.sonarsource.com/sonarqube/latest/setup-and-upgrade/install-the-server/
- https://docs.sonarsource.com/sonarqube/latest/devops-platform-integration/azure-devops-integration/
- https://www.microsoft.com/en-us/evalcenter/download-windows-server-2016