
Introduction: Microsoft’s sustainability dashboards are meant to make a tangible, positive difference to environment. In this technical blog, we explore customization of Microsoft’s dashboards to suit specific sustainability needs.
MSM Dashboards & Data representation
- MSM Dashboards are categorized into various sections such as Home Dashboard, and MSM – Analytics Insights overview (Scope 1, Scope 2 and Scope 3 dashboards for direct emissions, indirect emissions and other indirect emissions).
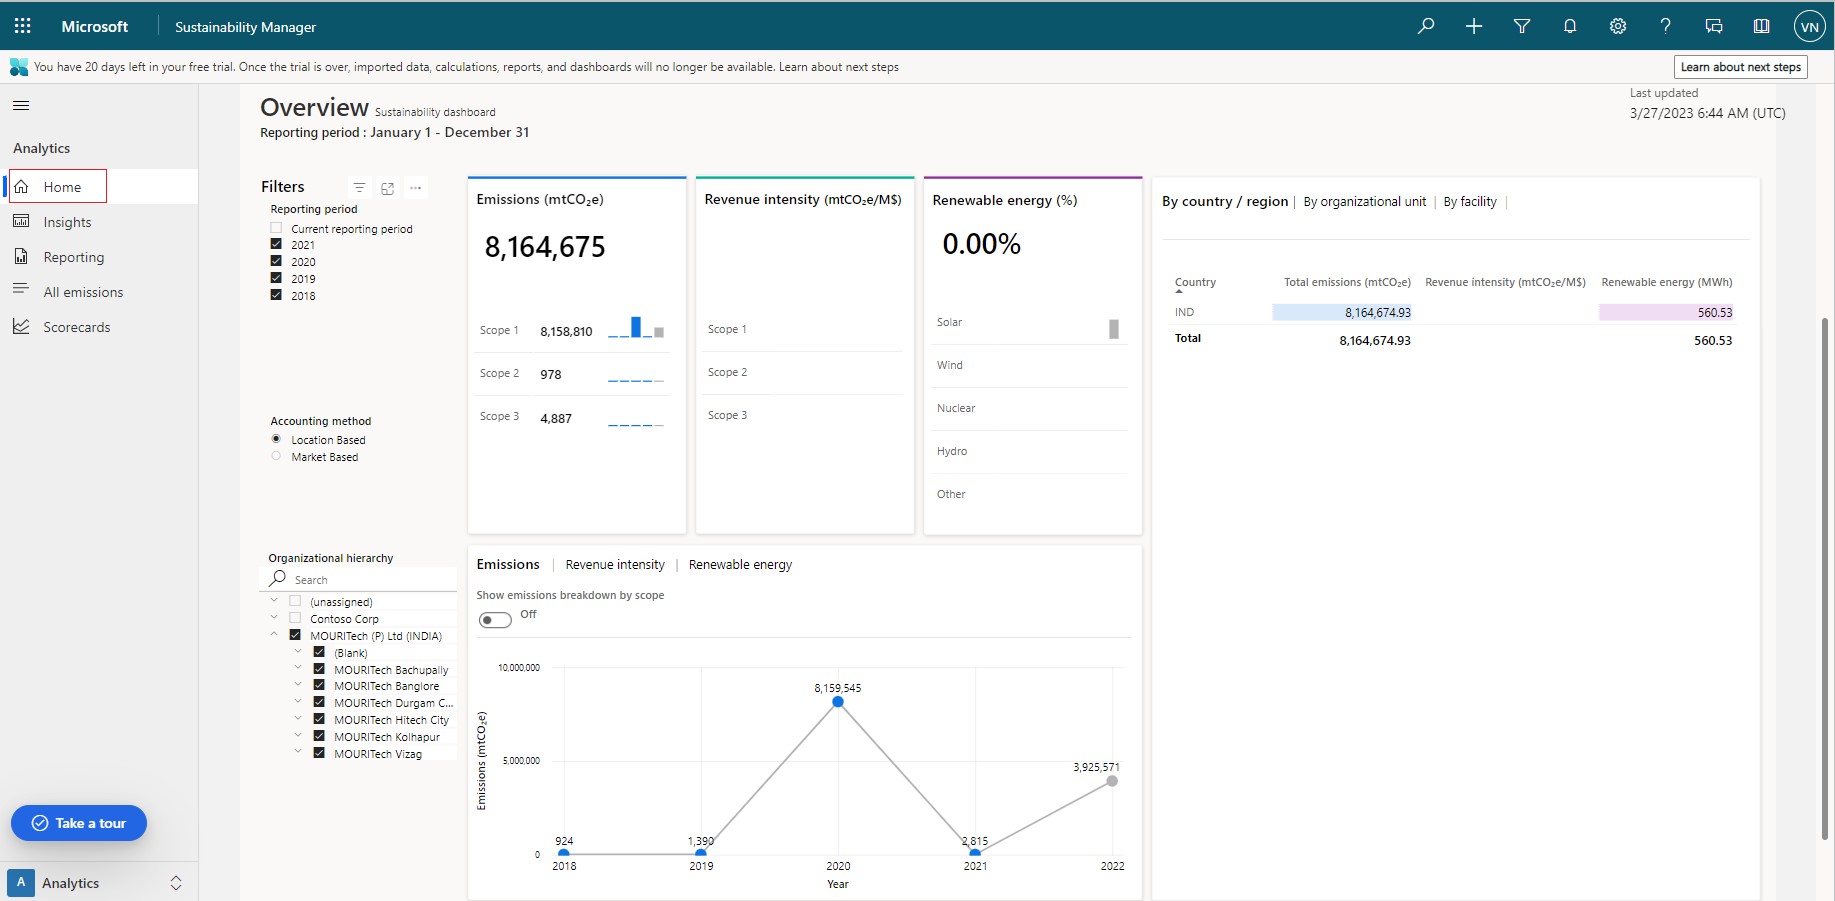
- MSM – Home Dashboard
The Home Dashboard contains the overall emissions summary with Revenue intensity of all scope emissions & calculations pertaining to renewable Energy.
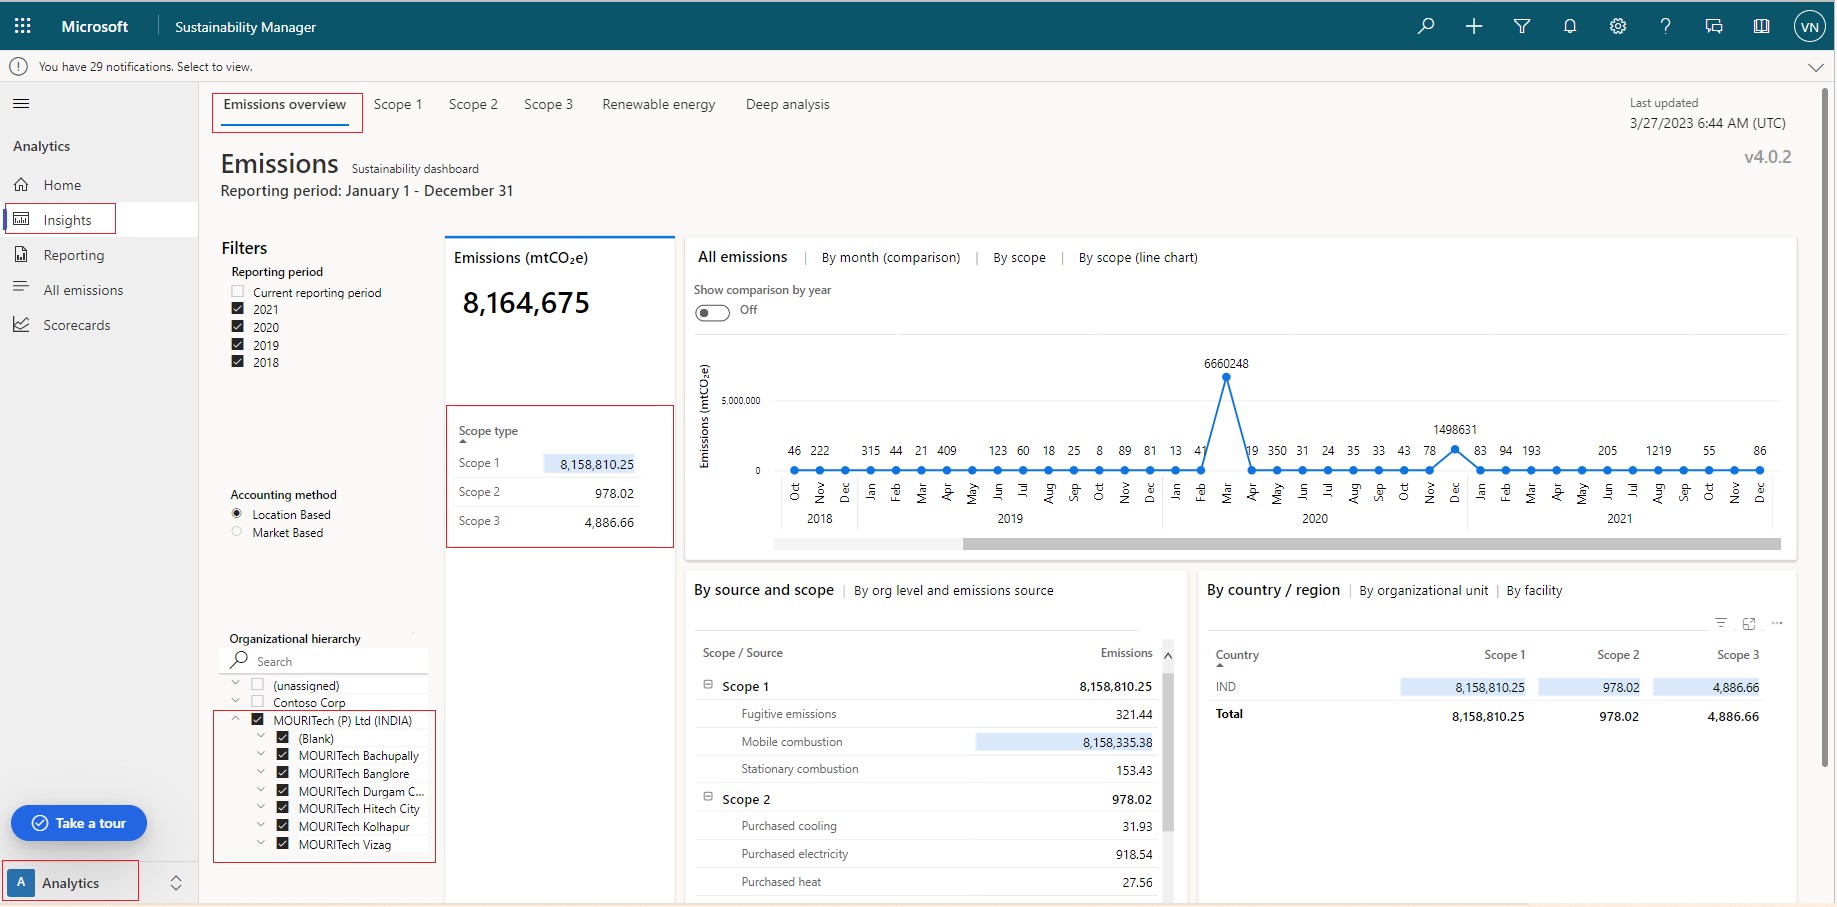
- MSM – Analytics Insights overview
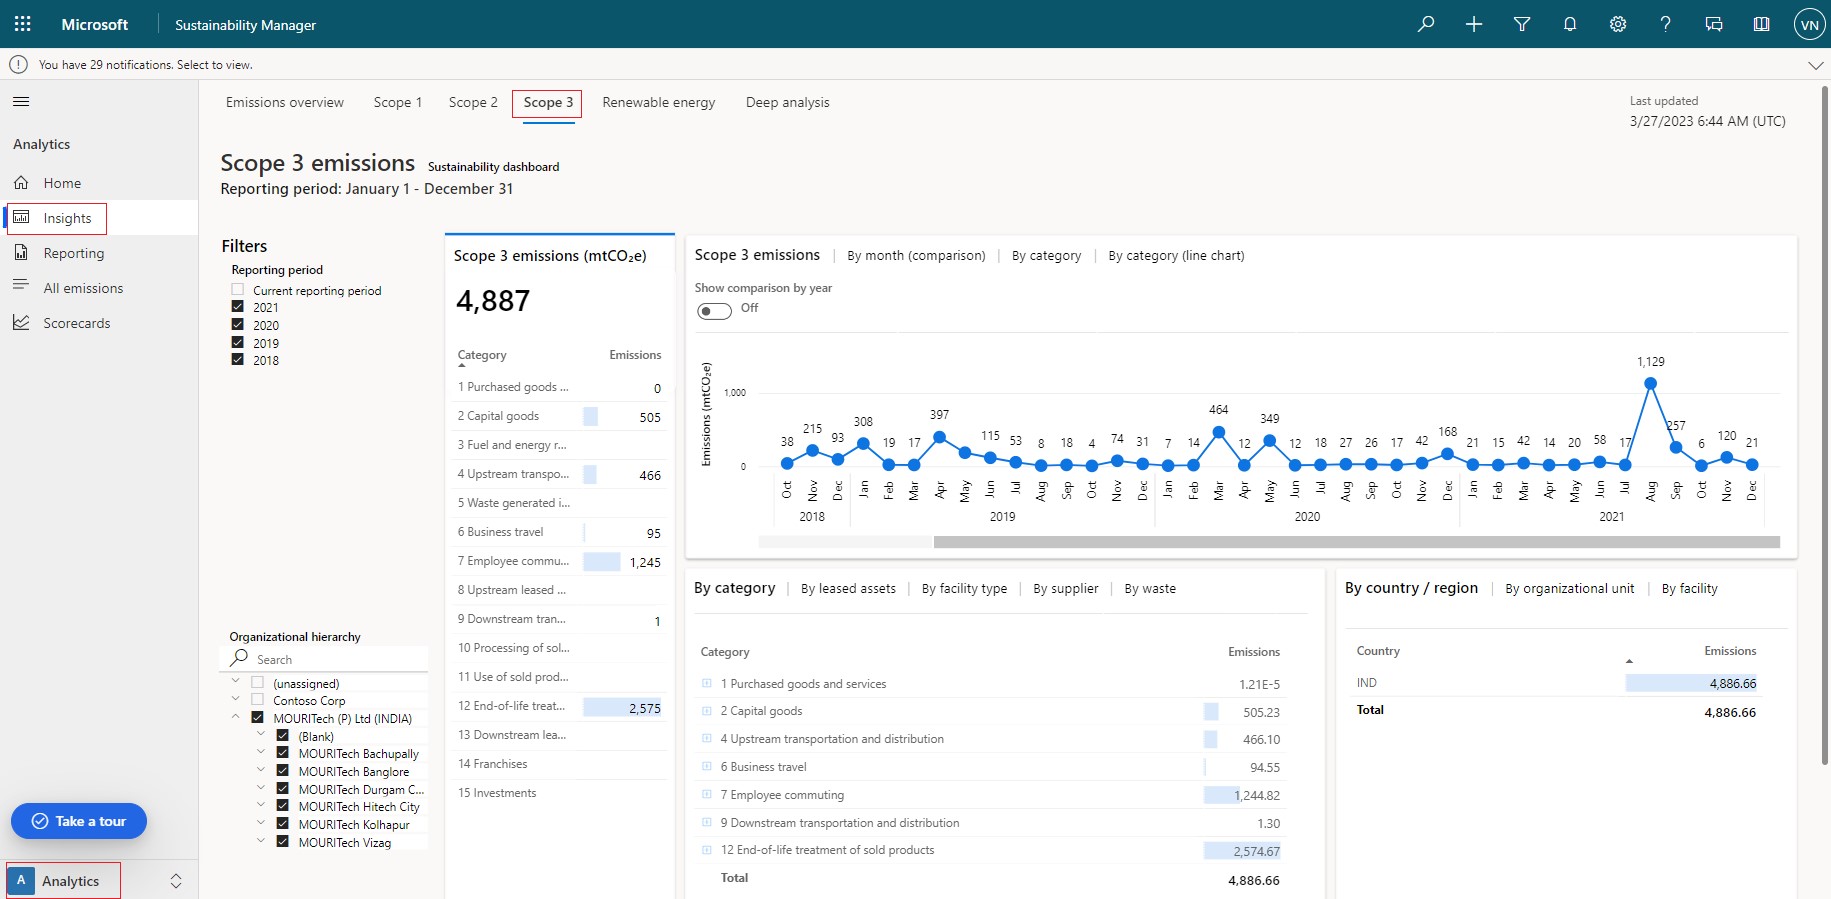
In Analytics Insights, there are separate sections to represent the data summary with filters options to display All Emissions Overview, detailed information of Scope 1, Scope 2 & Scope 3 emissions Components. The other sections contain Renewable Energy & Deep Analysis.
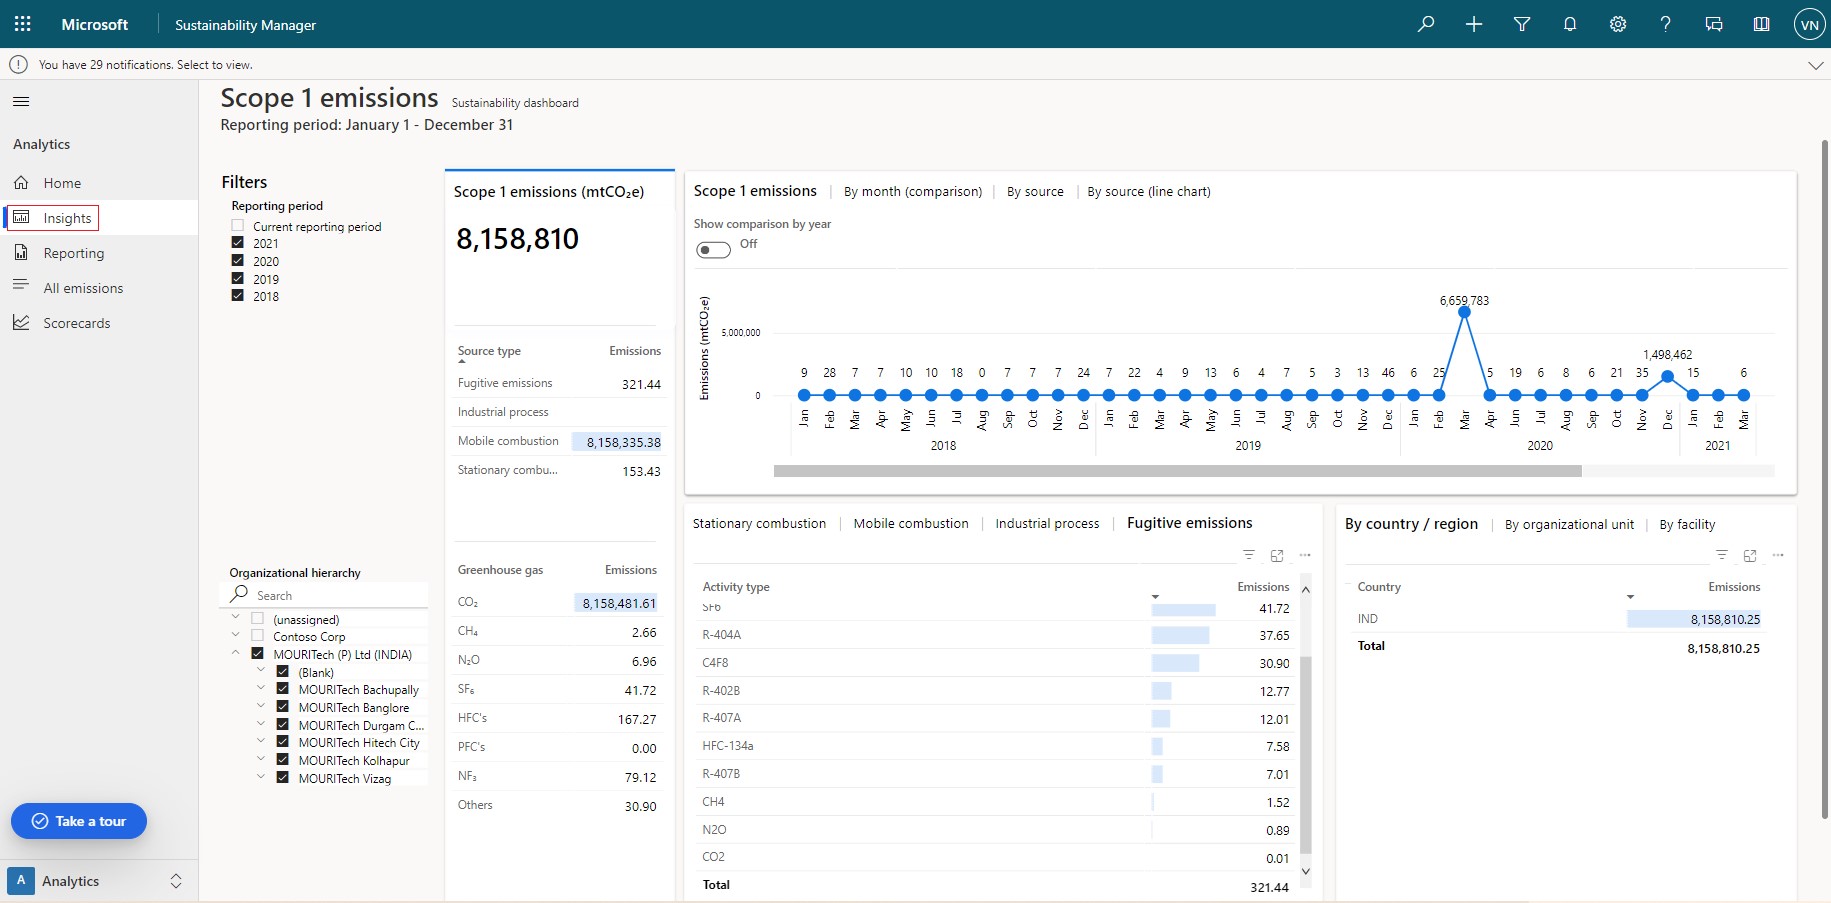
- MSM – Analytics Insights: Scope 1
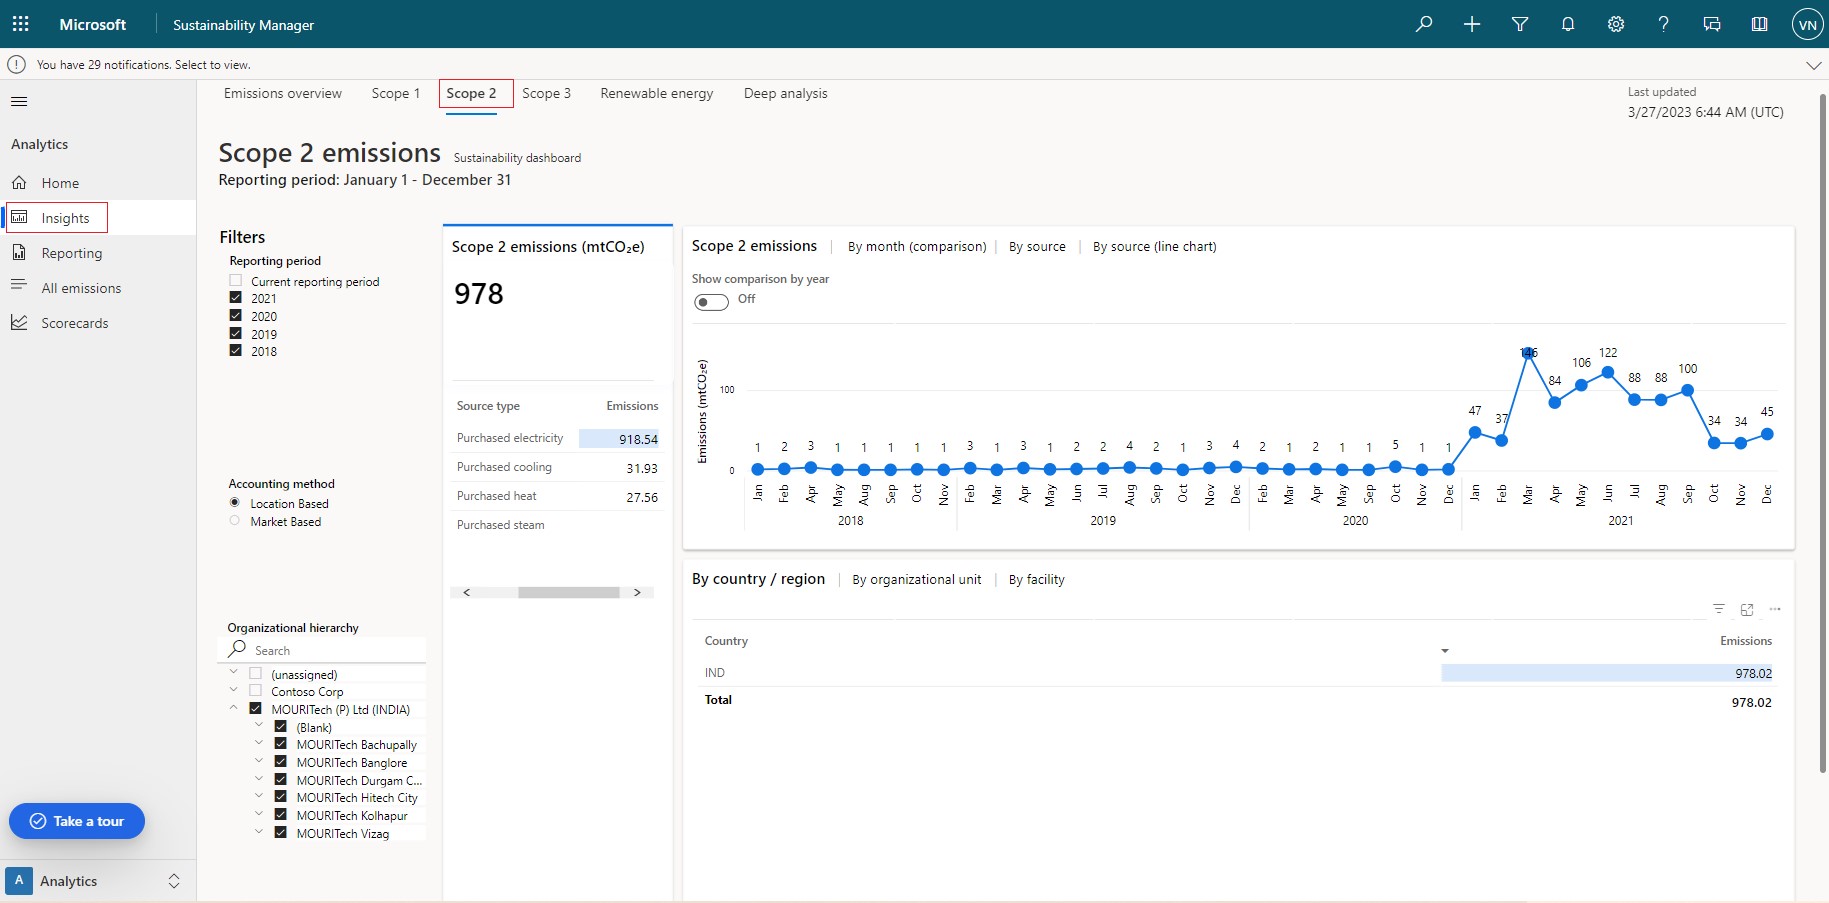
- MSM – Analytics Insights: Scope 2
- MSM – Analytics Insights: Scope 3
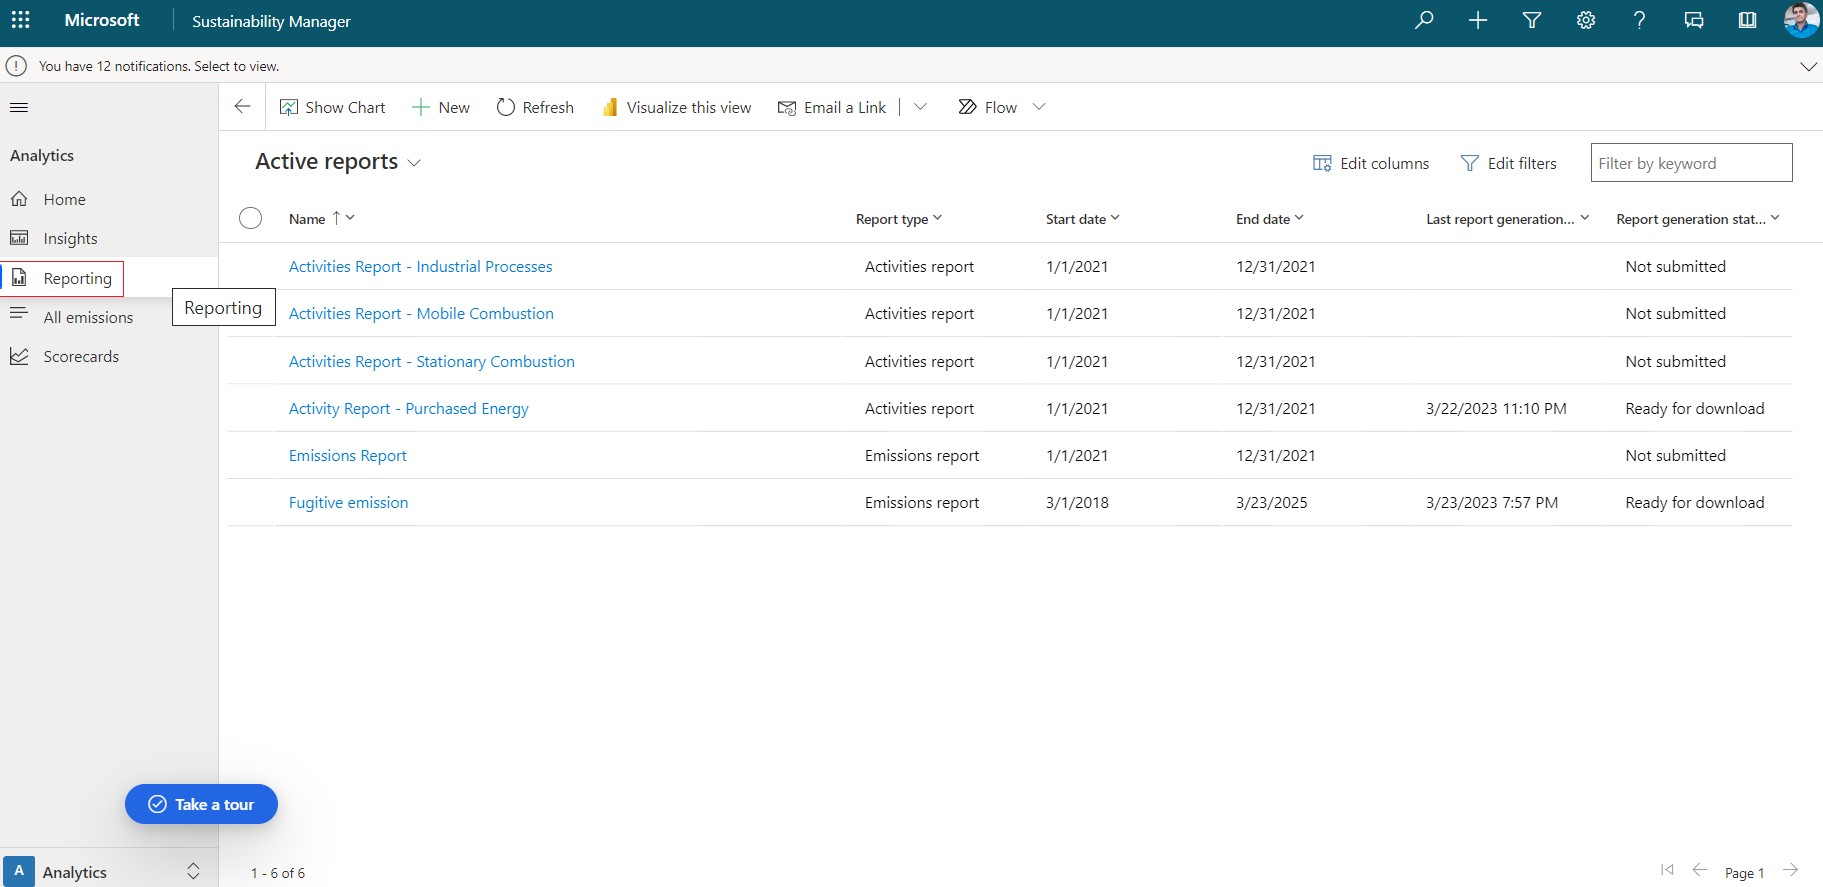
- MSM- Reporting
- MSM Publishes
pre-configured reports to represent various activities reports of pre-defined & configured emissions data entities. One can create/configure a new report based on the available emissions data entities. The data can be represented in excel sheets Power BI tools and can be emailed to stakeholders.
MSM – Key Observations/ Learnings –
- MSM Dashboading helps in identifying emission nature and volume.The three types of emissions – Scope 1,2 and 3 Direct Emission – Fugitive emission, Industrial Process, Mobile combustion, Stationary combustion, Indirect Emission – Purchase Electricity, Purchased Cooling, purchased heat, Purchased steam and any new emission type can be configured by customization.
To follow for a more functional use of the dashboards it will help –
- Setting factors & calculations models against each emission data type
- Exploiting the Tool’s three modules – Data, Settings, Analytics
The Emissions Impact Dashboard for Microsoft 365 permits businesses to measure greenhouse gas (GHG) emissions associated with their administration’s use of Microsoft 365 applications. The Emission Impact dashboard furthermore specifies a classification of discharges throughout all three of the scopes as outlined by the Greenhouse Gas Protocol:
EID Tool – a Value Added proposition
- The EID Dashboards helps measure Greenhouse Gas (GHG) releases connected with their organization’s usage of Microsoft 365 applications,
- ultimately moving productivity workloads to the cloud make lasting changes
The Data Items which can be configured are
- Carbon Intensity
- Emission Savings
- GHG Generation Report
- Usage Reports
- Calculation Methodology
Dashboard: Overview
The main dashboard focuses on displaying overall emissions, usage over time, as well as carbon intensity, which is a metric of carbon efficiency specific to cloud usage. This also provides a filter option to customize the data view in dashboard.
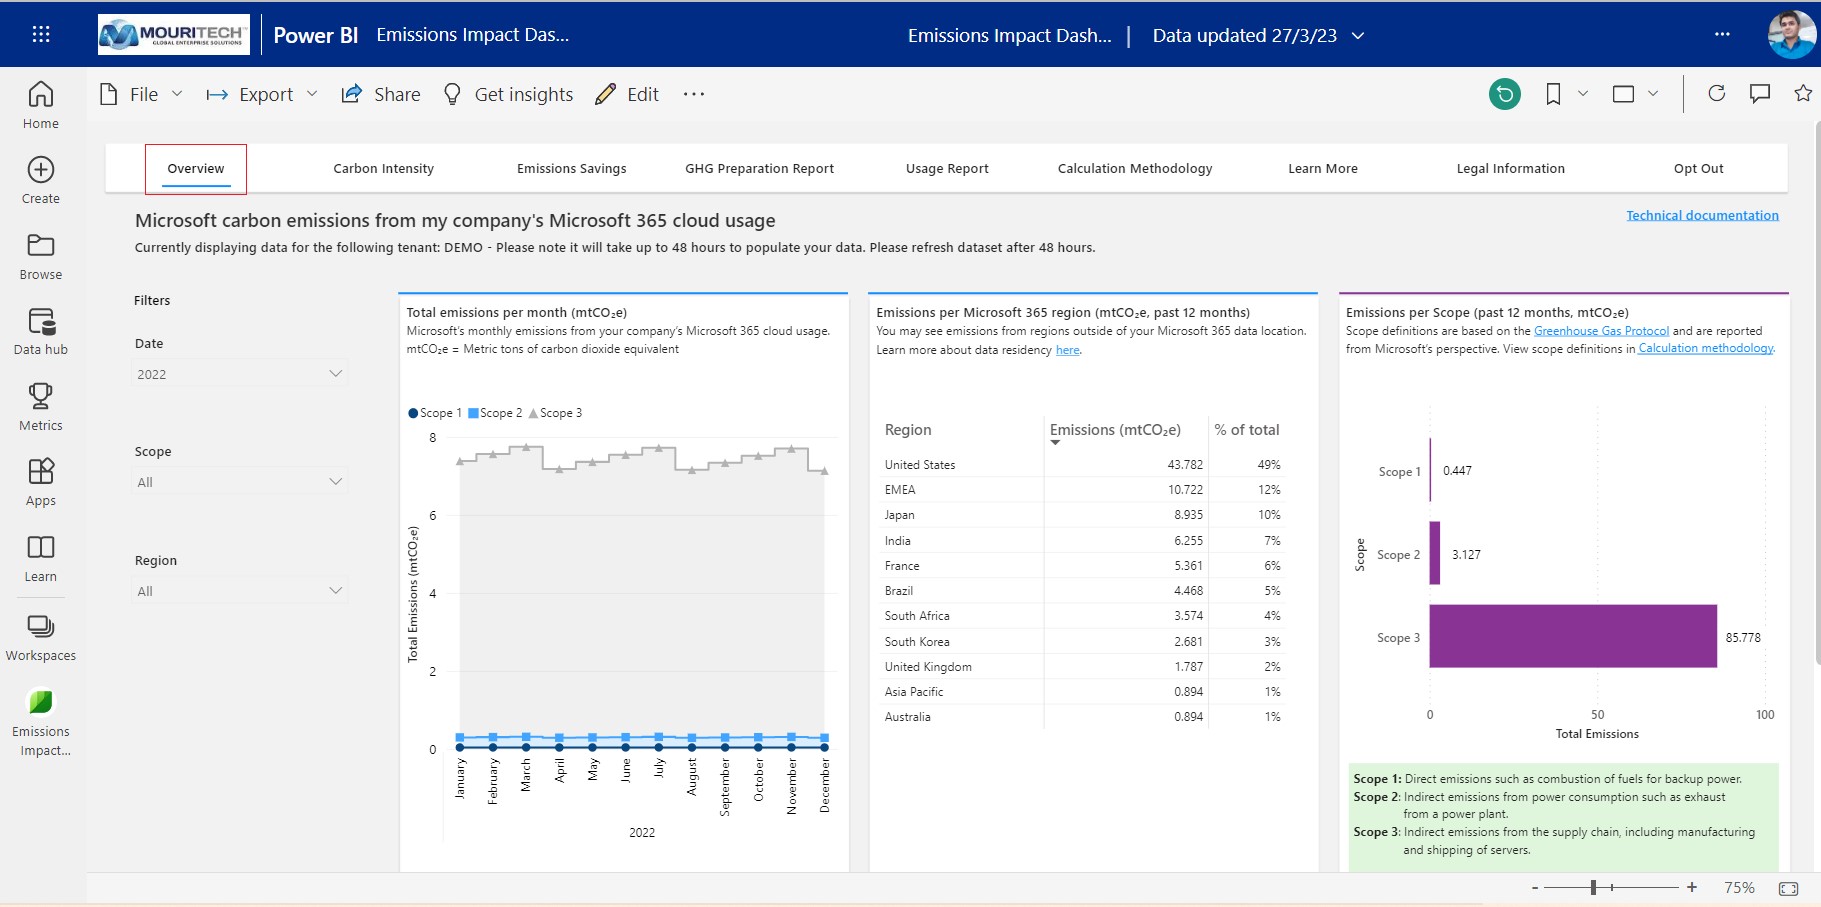
Dashboard customization and adding new data screen based on the data representation requirements is possible. We can export/download the data into various file format for further use or analysis. It can also be shared with stakeholders through emails.
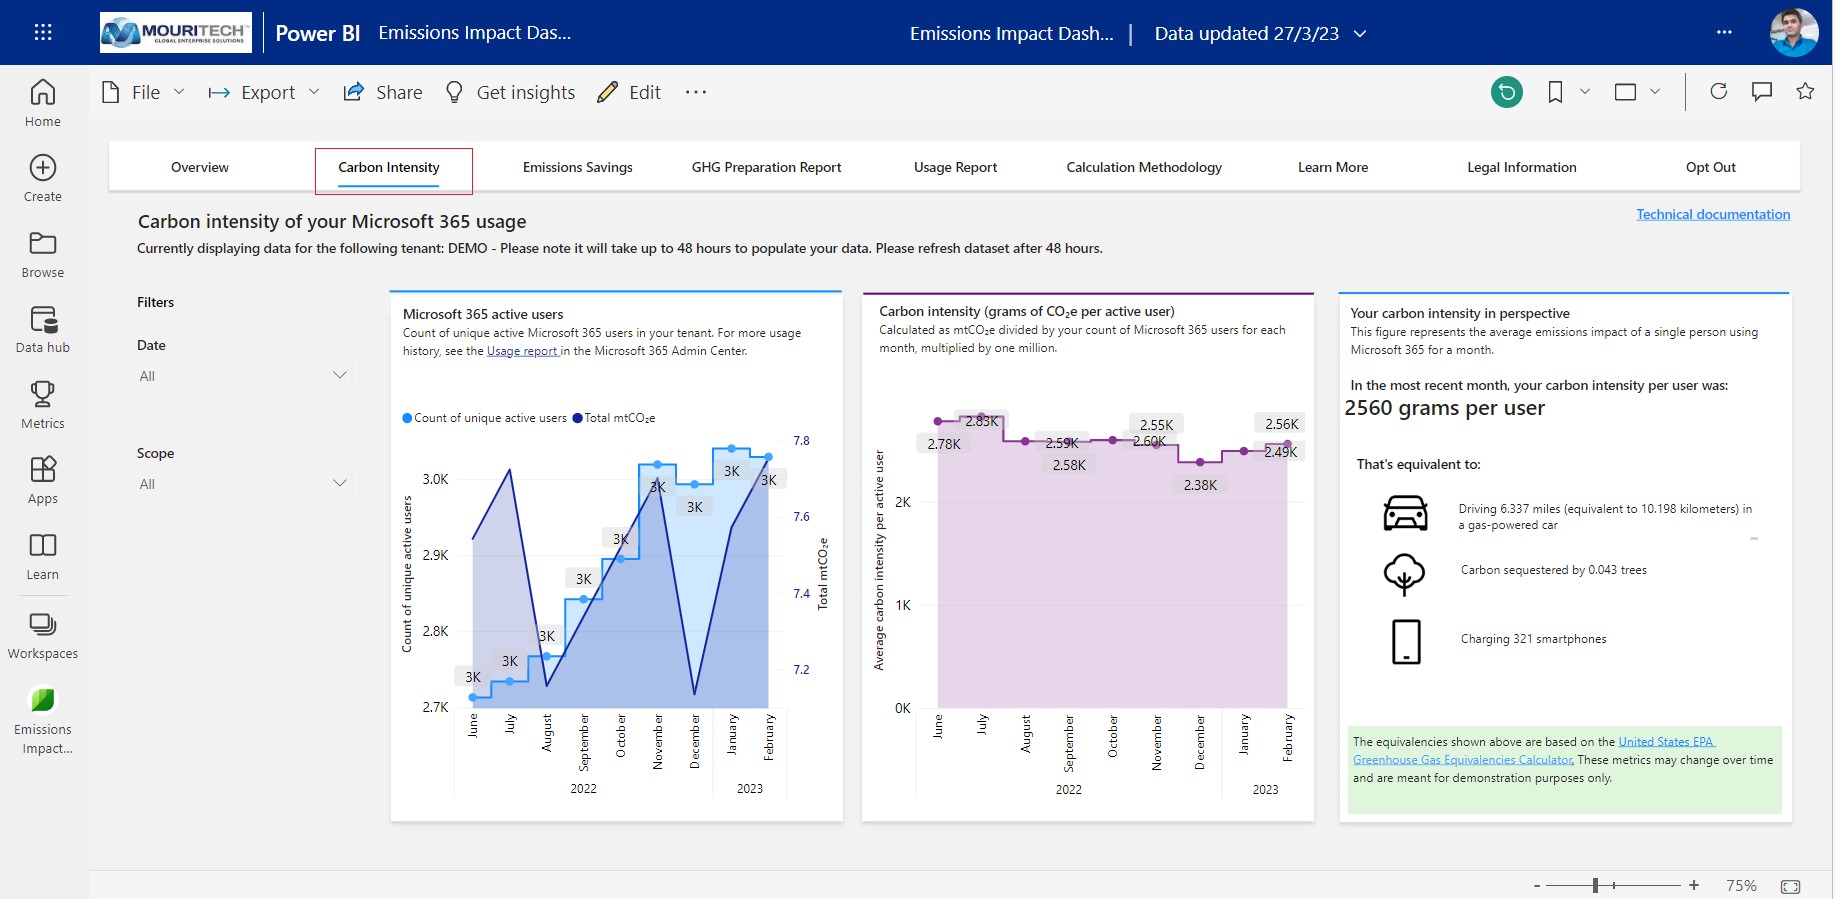
- Dashboard: Carbon Intensity
- Dashboard: Emission Savings
EID – Key Observations/ Learnings
EID for Microsoft 365 and EID for Azure are available with Out-of-the-Box features. They only need to to map to the org’s M365 or Azure Tenant. EID is to be licensed in, and uses can bank on Power BI Premium/Pro licenses to generate and analyze reports.
References
Microsoft Sustainability Manager overview | Microsoft Learn,
Calculating My Carbon Footprint | Microsoft Sustainability
https://www.sustain.ucla.edu/blog/