Summary:
This blog explains how dashboards are created in Python by using SQL data.
Objectives:
- Introduction to Matplotlib and Pyplot
- Establishing SQL Connection in Python
- Displaying dashboards in Python
Introduction to Matplotlib and Pyplot:
Matplotlib:
- Matplotlib is a popular visualization library for Python. It provides users with the ability to create a wide variety of static, animated, and interactive dashboards in Python
- With Matplotlib, we can create a wide range of dashboards, such as line plots, scatter plots, histograms, bars, and more
- Matplotlib is mostly written in Python; in some cases, we can write in C-Programming and JavaScript
- Matplotlib is an open-source library in Python and can be installed through the Pip package manager
Pyplot:
- Pyplot is a sublibrary of the matplotlib library in Python, which provides a collection of functions that allows users to create a wide variety of charts, bars, plots, and graphs
- With Pyplot, we can create charts, plots, and bars to customize by changing colors, fonts, labels, and other properties as well
To use Matplotlib.pyplot, we need to first import the Python library, which is shown below:
Import Matplotlib.pyplot as plt.
Establishing SQL Connection in Python:
- To establish a SQL connection in Python, we must install the ‘Pyodbc’ driver using pip
Pip install Pyodbc.
- After installation of “Pyodbc,” we can use the code below to establish a connection to a SQL Server database
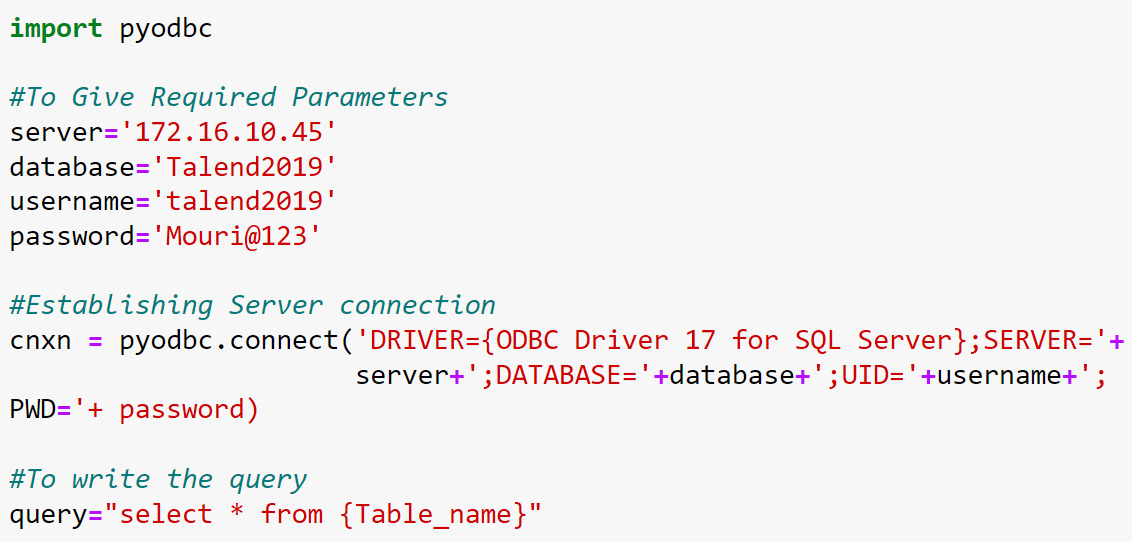
- In the above code, specify the connection credentials (server name, database name, username, and password). Then we use ‘ Connect ()’ method to establish the connection
- Once the connection is established, we can write a SQL query
Displaying dashboards in Python:
- To create a dashboard in Python, we must import the required modules first
- After importing modules, we can establish a connection between Python and SQL Server
- Once we had established a connection, we wrote a SQL query for the required data and converted it into pandas’ data frame
- Now we can display the dashboard by using Python code
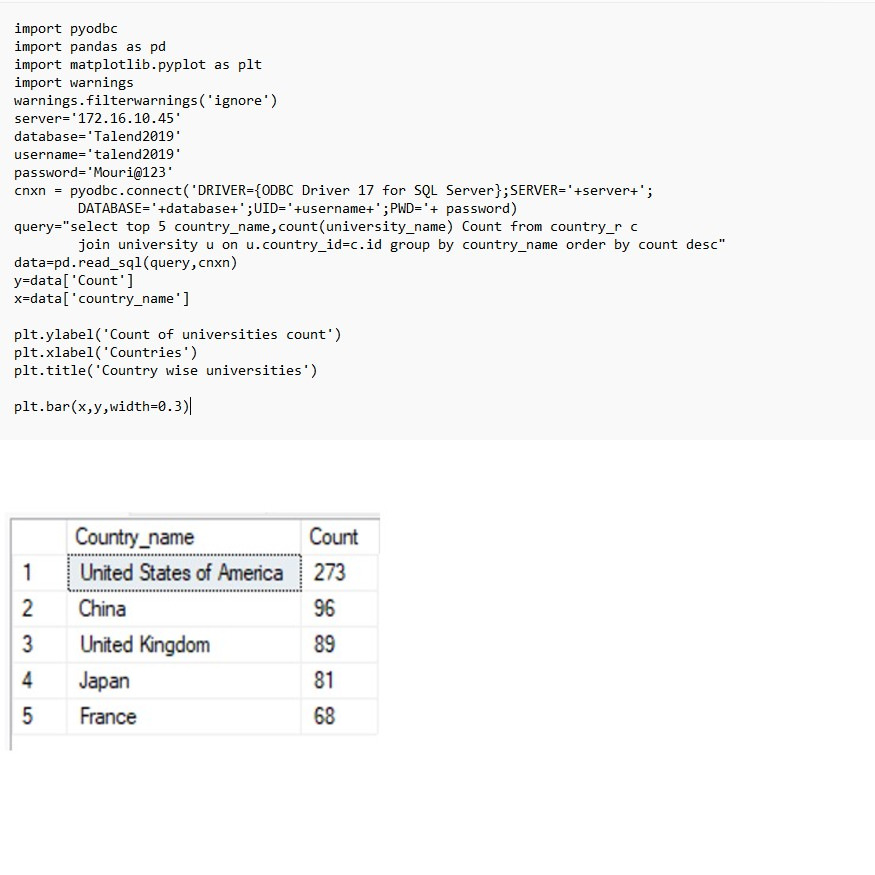
- In the above code, the bar () function takes two arguments that represent the layouts of bars
- Their values are represented by x and y arguments as an array
- After declaring values, call the plot to see the dashboard

- We can also customize the dashboard by changing the title colors, fonts, and position
- By using the below lines, we can change colors for bars, labels, titles, and different fonts for labels and titles
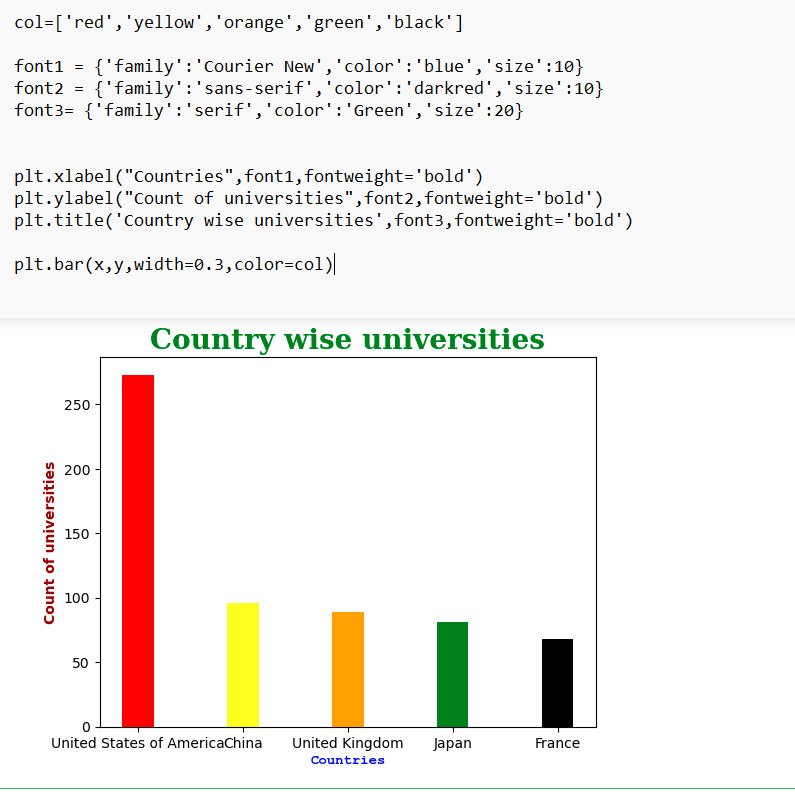
- Not only bars, but we can also display plots, Subplots, and pie charts by matplotlib
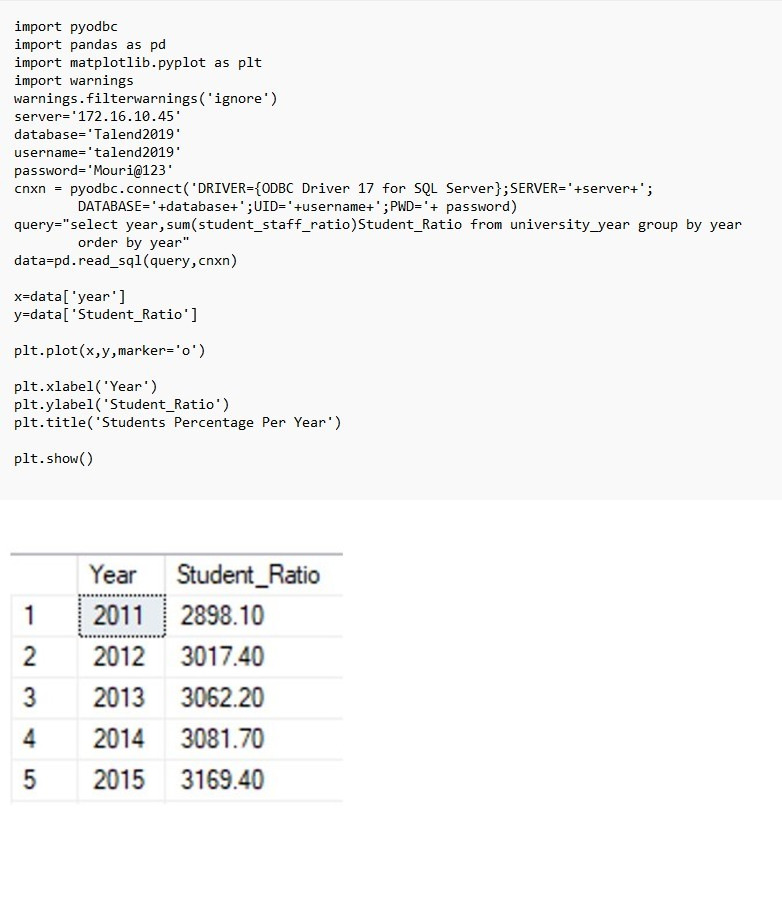
Plots:
- The plot function is used to draw a graph
- It Contains X-axis and Y-axis as a parameter
- As discussed above, importing module is the same for all dashboards in matplotlib
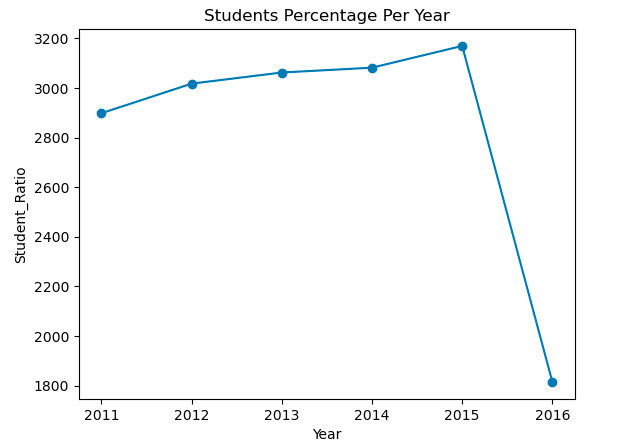
- We just need to give the type of dashboard in the code per requirements
After Execution, it will display a dashboard like the one below.
Subplots:
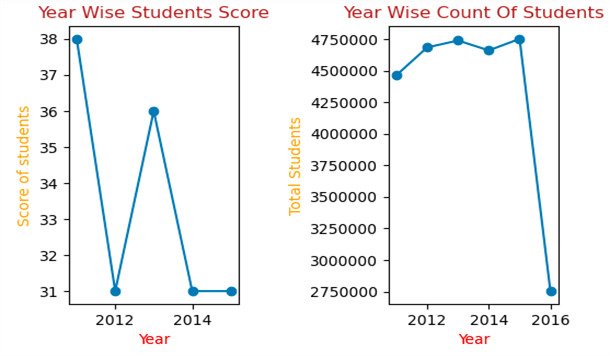
- With subplots, we draw multiple graphs in single frames.
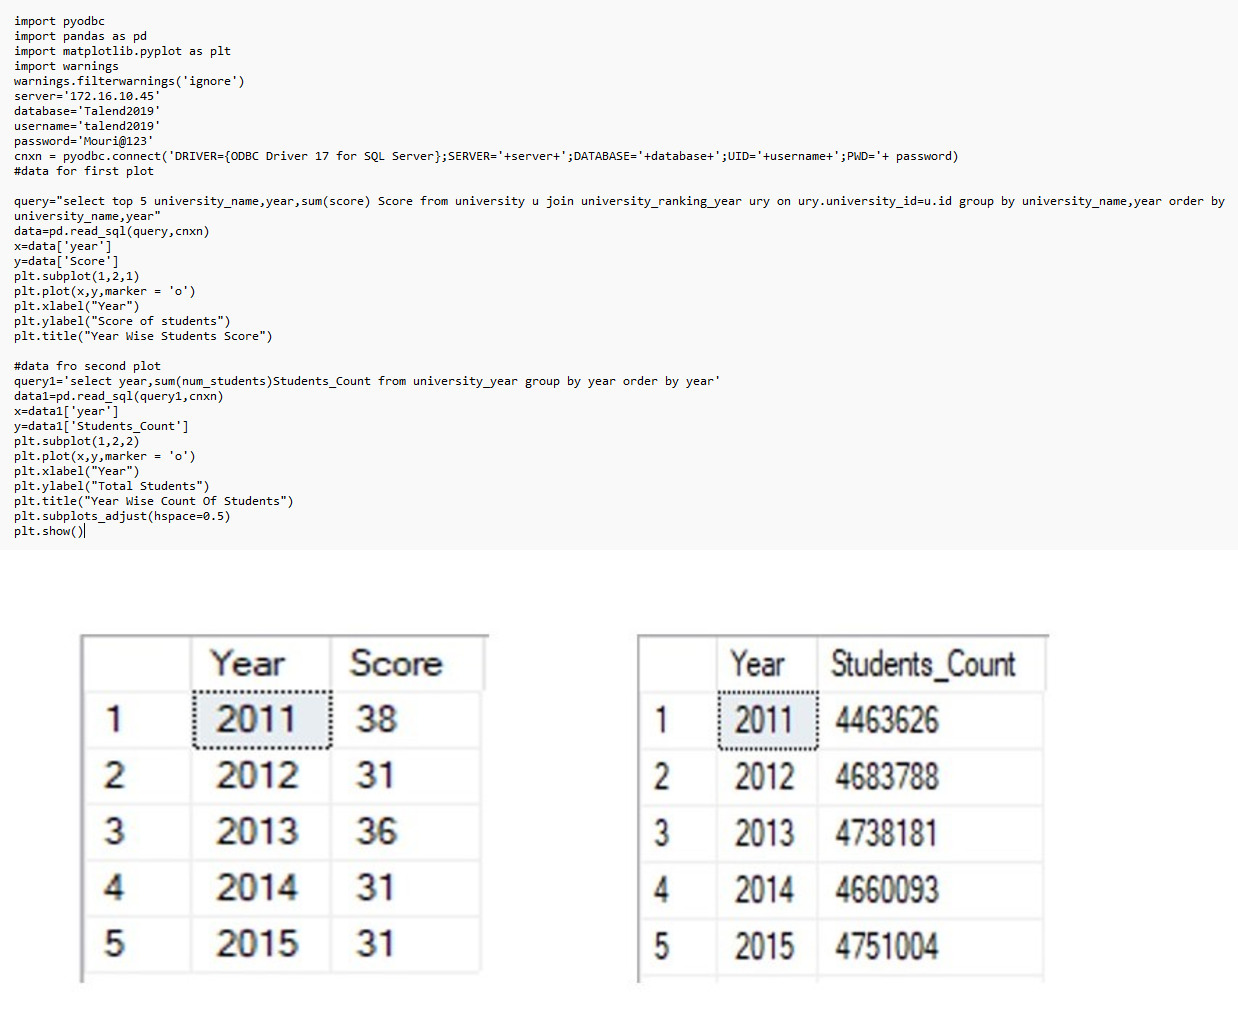
- In this plot, we must mention how many rows and columns are required to display and their respective positions, as mentioned in the code
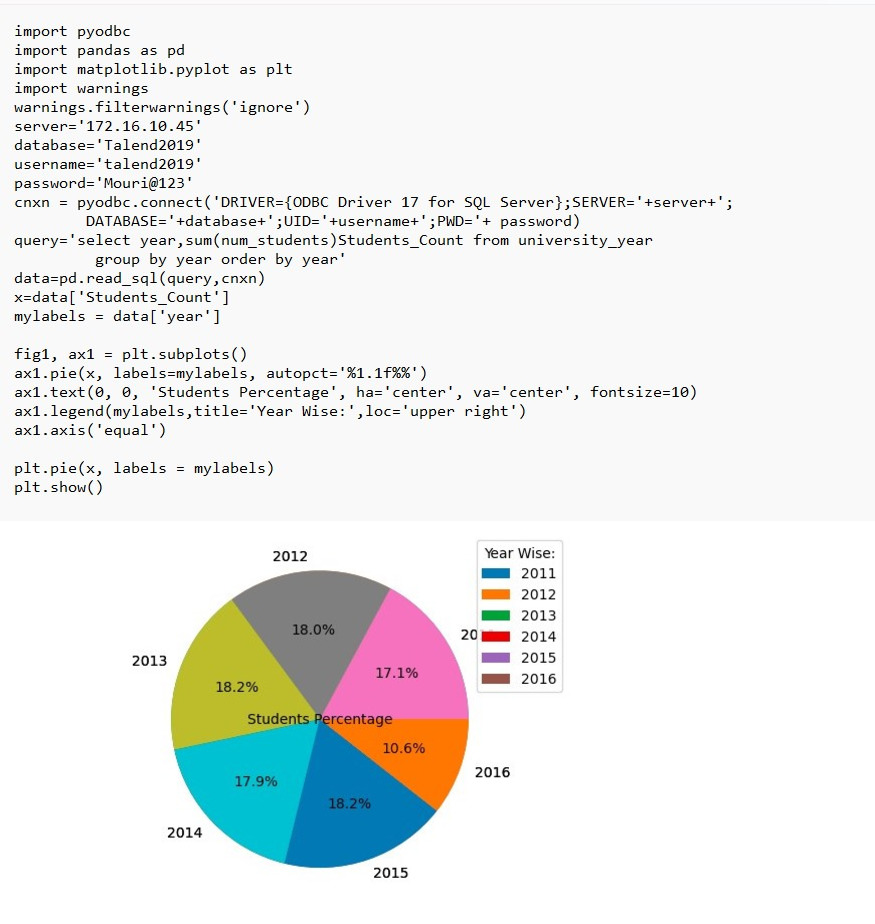
Pie Charts:
- The pie chart is a circular graph that is used to represent proportional data
- The Matplotlib pie chart can be created using the pie () function
- We can also add parameters like labels, colors, start angles, and shadows in pie charts as per business requirements
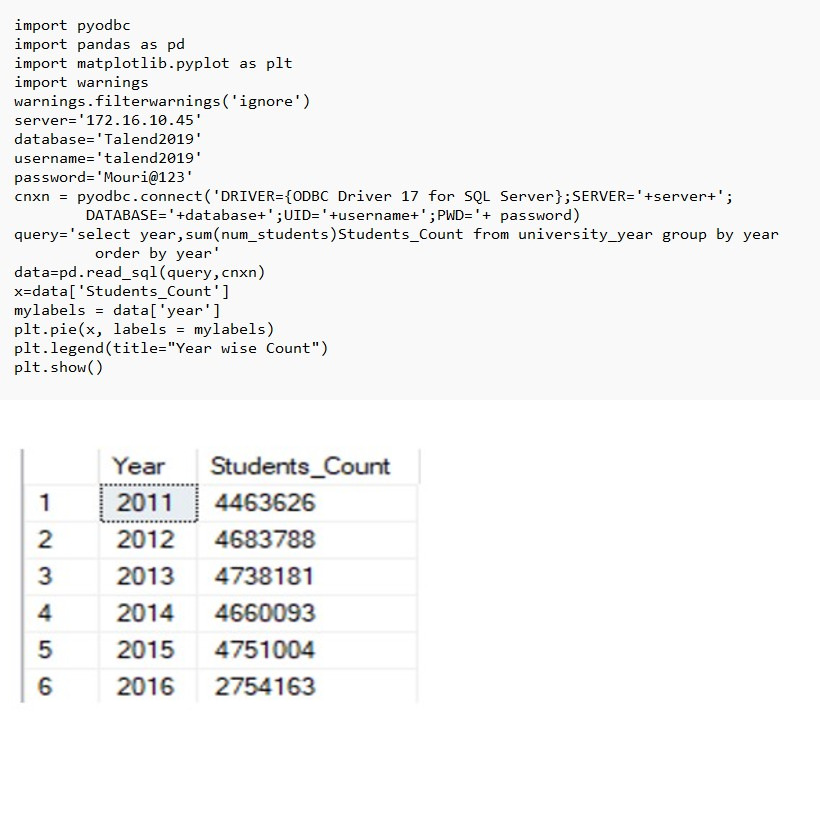
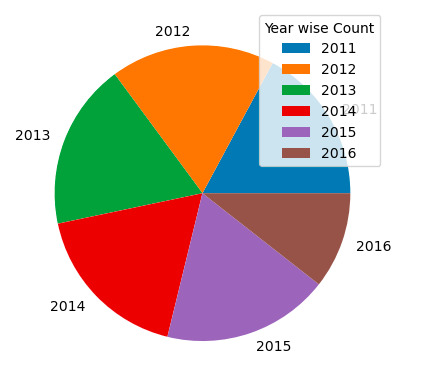
- We can also customize the pie chart based on user requirements.