Purpose of the article: Chart swap is essentially to show group of icons that will determine what type of chart we’re going to use and present
Intended Audience: Tableau developers.
Tools and Technology: Tableau, Excel
Keywords: Dynamic Zone Visibility, Swapping, Control Visibility
Chart Swap Implementation with Dependent Filters:
We need to use a data source – it could be sheet or Database – for creating Charts. The following is the list of steps to be adopted to achieve it.
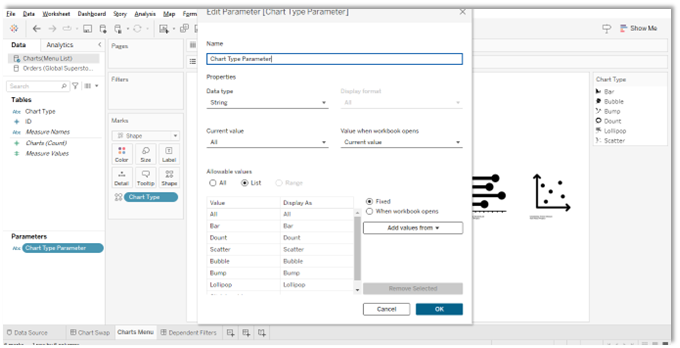
- We are going to create a parameter. Name your parameter with whatever name you like (Ex: Chat Type parameter). Then change your data type to a ‘string and select’ list and input the names as shown below.
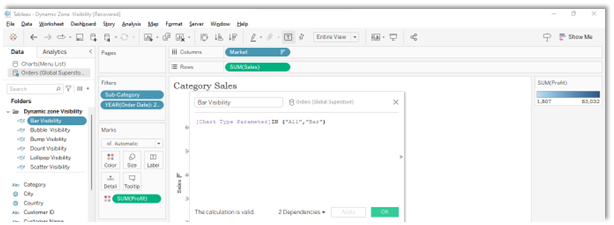
- Create Six calculated fields, one called Bar Visibility and Bubble Visibility …etc as shown in the following screenshot. Drag and drop the parameter you previously created (Chart type parameter) in the calculated field. Similarly, we have to create other calculated fields based on respective chart types.
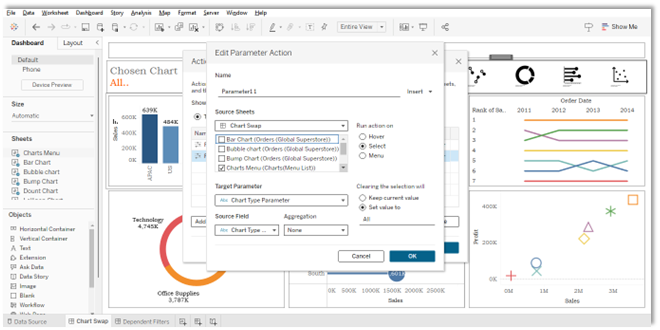
- We have to add Parameter Action using the parameter we created before. And select source sheet and target parameters and other options as shown in the following screenshot.
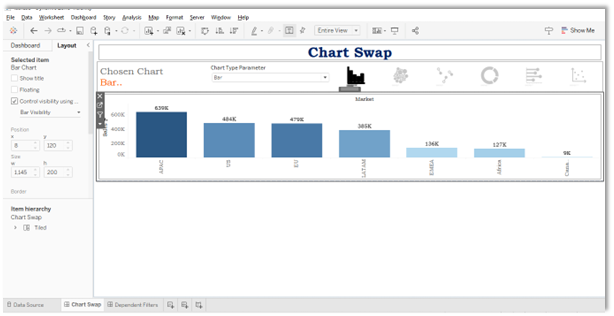
- Let’s build our dashboard. Drag the horizontal container onto the dashboard. Then drag the six sheets as shown below. Sheet Swapping, click on the bar on the dashboard, then go to layout and tick control visibility using value. On the drop down, select bar visibility. Repeat the same process with the remaining sheets also.

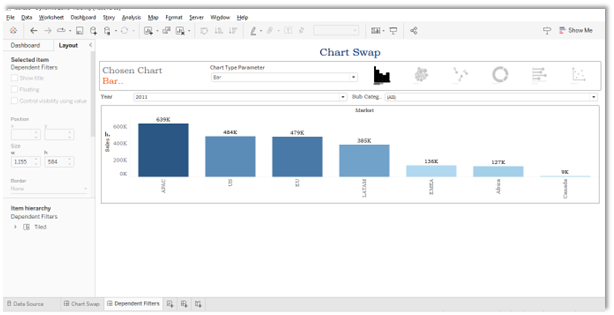
- In the above screenshot, at the top right corner, we have icons; if you click a specific icon, then it will display only the corresponding sheet as shown below:
Dependent Filters:
There are filters that apply only to certain charts but not all.
- For bar chart, the filters are year and sub-category
- For scatter plot, you have year and segment
- For donut, you have year and sub-category, and likewise for others
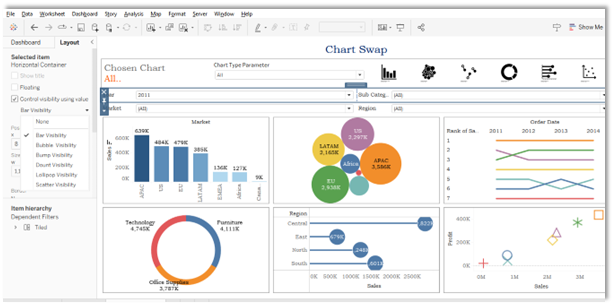
- Drag the horizontal container into the dashboard. Click on the bar filters on the dashboard, then go to layout and tick control visibility using value. On the drop down, select bar visibility. Repeat the same process with the remaining filters also. At the top right corner, we have icons and if you click specific icon, then it will show only corresponding sheet, as shown below, along with its specific sheet filters.
Author Bio:

Maneesha RAMIREDDY
Associate Software Engineer - Data Visualization-Analytics
I am working as an Associate Software Engineer at MOURI Tech for nearly two years. I have good experience in Tableau, SQL and Power BI..


