Purpose of the article: Uncover the power of React and react-chart-2.js as we delve into the world of data visualization. This blog will guide you through the essentials of integrating and customizing charts in React applications, empowering you to create stunning and interactive visualizations. Whether you’re a beginner or an experienced developer, this comprehensive guide will help you harness the full potential of React for effective data representation. Elevate your web development skills and gain a deeper understanding of building dynamic, informative, and visually appealing charts in React.
Intended Audience: React.js developers seeking powerful and customizable charting components for dynamic data visualization. For people with all skill levels ranging from a beginner looking for straightforward implementation to an experienced developer in need of advanced charting capabilities.
Tools and Technology: HTML, CSS, Bootstrap, JavaScript, React JS
Keywords: None
What is Chart.js?
React-chartjs-2, which is based on Chart.js, is one of the most widely used libraries for rendering charts in React. It contains a lot of charts such as Bar Chart, Line Chart, Pie Chart.
Chart.js is a JavaScript library for creating beautiful and interactive charts in web applications. It provides a simple and flexible API for creating various chart types, including bar charts, line charts, pie charts and more.
Prerequisites
Before we start, ensure that we have the following pre-requisites:
- js installed
- A basic understanding of React.js
Steps to Achieve the Chart.js in Angular Using ng2-Chart
Step (1): Setup project and Installations
Step (2): Create components
Step (3): Implement of charts
Step (4): Final result
Step (1): Setup Project and Installations
Create a Project:
Let’s create a new project with the help of the following command
npx create-react-app <project-name>

- After creating a project, we need to move that project and also open the visual studio with the help of the following command:

Installations:
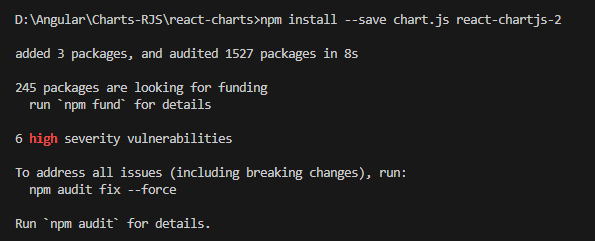
- Open terminal/command prompt in visual studio and install the react-chartjs.
- Install the react-chartjs-2 with the help of the following command:
npm install –save chart.js react-chartjs-2
Step (2): Create Components
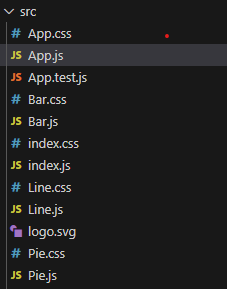
Need to create a different component in our project.
Here, we have created three components: bar chart component, line chart component, pie chart component. We can observe below.
Step (3): Implementation of Charts
In our project, we need to discuss three charts: bar chart, line chart and pie chart. Let’s discuss them one by one.
Bar Chart:
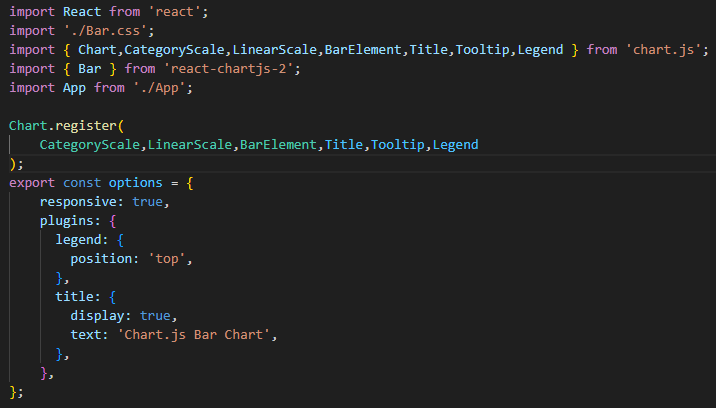
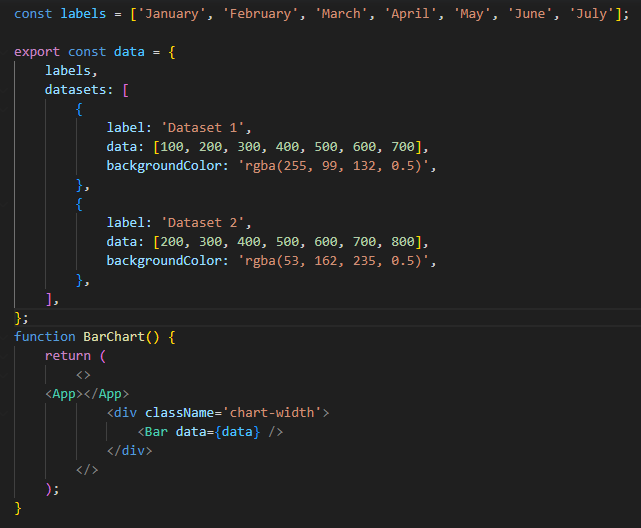
This example creates a simple bar chart with dataset. You can customize the chart by modifying the data and options objects according to your requirements.
Remember to import the necessary styles for the chart library in your project. If you are using a CSS bundler like webpack, you can import them in your entry file (e.g., index.js or App.js).
This example assumes a basic setup. In a real-world scenario, you may want to fetch data dynamically, handle state changes, and use more advanced chart features based on your application needs.
In our project, we already created a bar chart component. Let’s implement the bar chart component.
Line Chart:
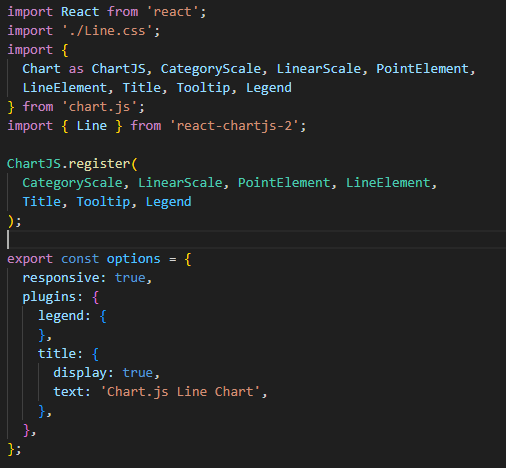
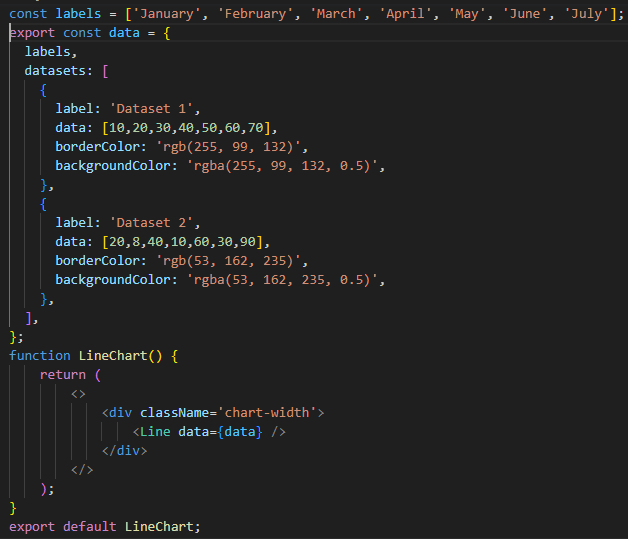
This example creates a pie chart with data. Just like with the bar chart example. You can customize the chart by modifying the data and options objects according to your requirements.
Remember to import the necessary styles for the chart library in your project.
In our project, we already created a line chart component. Let’s implement the line chart component.
Pie Chart:
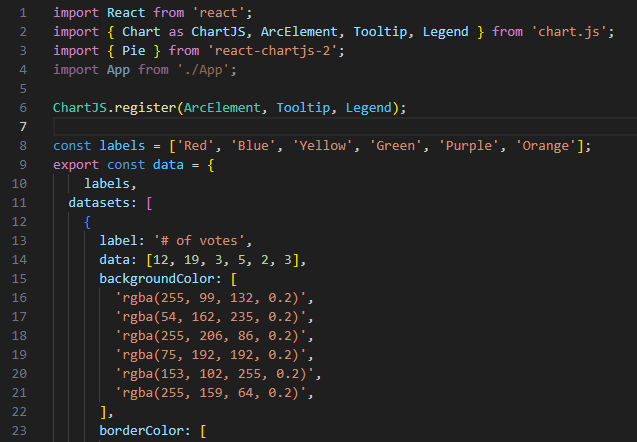
This example creates a simple pie chart with data. You can customize the chart by modifying the data and options objects according to your requirements.
Remember to import the necessary styles for the chart library in your project.
In our project, we already created a line chart component. Let’s implement the line chart component.

Step (4): Final Result
- Need to run the application by using following command:
npm start

- Now, we need to observe the final results of all charts in the browser.
Bar Chart:

Line Chart:

Pie Chart:
Author Bio:

Divya Krishna PITTA
Software Engineer - UX/UI-Digital Transformation
I have 2+ years of hands-on experience in UI development, good knowledge in React.js. I recently authored a comprehensive blog on React, showcasing my expertise in crafting engaging and efficient user interfaces. I continue to explore innovative solutions and share insights to inspire fellow developers in the dynamic world of React.js.


